

Walsall by numbers
 In a new series of articles to D3D4 I will be looking at how each team in League One and Two are doing based on the numbers recorded by InStat.
The idea is to give fans an overview of how their side is performing in a number of key areas and which players on the team are leading or lagging in certain metrics. Obviously, and before we get into the stat debate, this is not going to tell the whole story but then that is not the aim.
These pieces will hopefully be a window in to some of the key performance areas of your side and allow you to see where things are going well and where they can improve.
To start this series I have chosen to look at the Saddlers…so here goes
Goalkeeping
Ever present this season Liam Roberts has been pretty solid. He has faced 130 shots on target and made 96 saves giving him a save % of 73 which puts him in the mid-range of ‘keepers in League One. His 37 ‘super saves’ which are saves made on shots with a high percentage chance of going in, is the second best in the division behind Plymouth Argyles Matt Macey who has made 44.
Of the 756 passes Roberts has made 579 have been accurate giving him a 77% accuracy rating on his pass distribution. This ranks 17th for goalkeepers in League One who have played over 1,000 minutes of action.
Defence
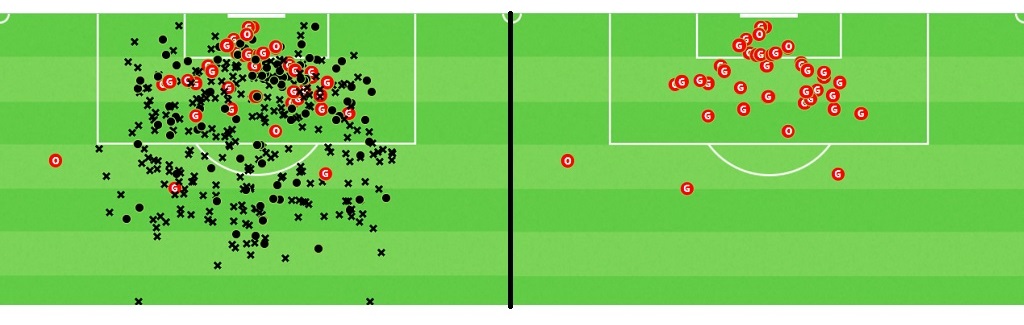
Shot map of shots against on the left and goals conceded on the right. Black dots are attempts on target with crosses being those wide or blocked.
Widely considered to be a problem area for the Saddlers, it is fair to say that improvement is needed. The team ranks as the sixth worse in the division by goals conceded but they also perform poorly in terms of xGA (expected goals against).
In terms of this metric they give up the fourth most scoring chances in the division with an xGA of 45.16, only just out performing this having conceded 41 goals.
They have allowed 75 shots from set-pieces with nine conceded (see graphic below). Stopping crosses and balls into the box should be a priority.
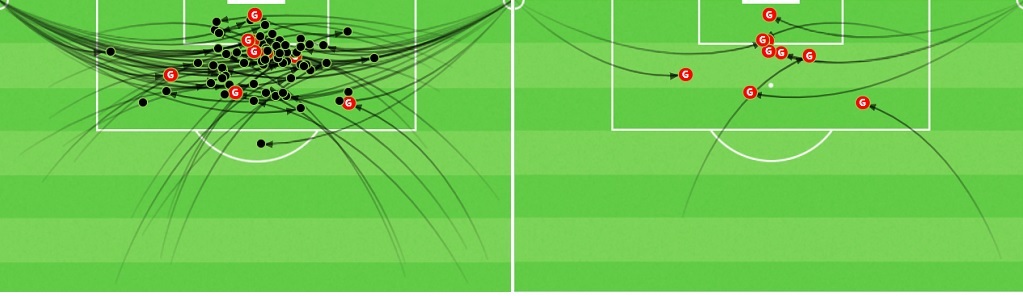
Set-pieces with shots allowed with set-piece goals conceded on the right.
The key performer at the back is Jon Guthrie who has won a team leading 291 defensive challenges, this is 75% of all those he has contested. He is amongst the top 10 defenders in the division using this metric. Compare this to his usual partner at the back, Jack Fitzwater, and you can see a big difference. Fitzwater has won 169 defensive challenges, 70% of those he has contested. Full-backs Luke Leahy, well known for his attacking prowess, has won 59% of the defensive challenges he has contested while Nicky Devlin has a 64% success rate.
Guthrie also leads the defence in aerial challenges won with 214, second on the team only to Andy Cook’s 223.
Leahy though does offer a lot going forward which we will come to later.
Midfield
In the middle of the park George Dobson is probably the club’s most highly rated talent but does he deserve this title? Looking at how he has contributed this season, no Walsall midfielder has created more chances than the fifteen created by Dobson. He has also drawn more fouls than any other midfielder which suggests he is a handful.

Only Luke Leahy has made more accurate passes than the 830 Dobson has supplied within the squad and though his key passes, those that are to another player in a goal-scoring position or that cuts off three or more players in the attacking phase, need to be more accurate. Only eight of the 23 he has attempted have found their mark though only Leahy has attempted more.
Dobson has also won nearly 100 more challenges than his midfield partner Isiah Osbourne with 222 compared to 140 and he has had 20 shots with six hitting the mark. Kieron Morris is the most attacking midfielder based on shots with 25 though only five have been on target while Zeli Ismail has 21 shots with nine on target.
Attack
The Walsall attack has some issues if you just look at goal scoring. Only three teams have scored less than the Saddlers in League One and in terms of xG they are vastly underperforming with 36.76 compared to the 28 they have actually netted.
Andy Cook is clearly a real handful and has created more chances than any other player on the team with 24 and then comes Mr Leahy.

For a full-back he has some pretty decent numbers. 21 chances created and 38 key passes attempted (with an excellent 22 finding their man) makes the former Falkirk man a real threat going forward.
He leads the team in crosses attempted by some margin. Of his 105 attempts 44 have been accurate with Nicky Devlin second in both marks with 73 attempted and 23 finding their target.
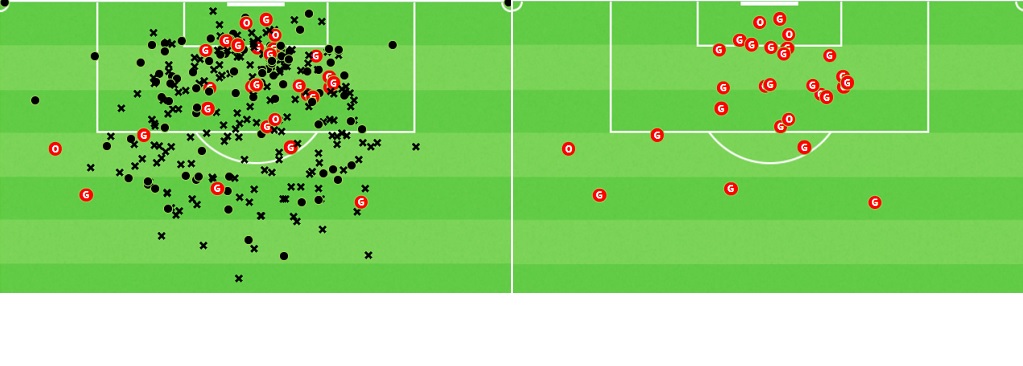
Shot map of attempts on goal with goals scored on the right. Black dots are attempts on target with crosses being those wide or blocked.
Walsall have had 303 shots and scored 28 times which, compared to the 384 they have allowed, is not great. The key attacking force appears to be Andy Cook who has had more than shot on target than both Morgan Ferrier and Josh Gordon combined. His 31 attempts that have hit the target only seven have hit the back of the net but you feel he is the most likely source of goals in the team. He has had 34 chances and converted just over 18% of them.
Morgan Ferrier has a better conversion rate with 21% of his chances finding the net. Zeli Ismail is more clinical than any of his team-mates converting three efforts of 11 clear-cut opportunities giving him a 27% conversion rate.
Oh and who has completed the most dribbles in the Walsall side? Morgan Ferrier with 48.
words James Richards, D3D4 Football